

US retail gasoline moved fast enough that households felt it before economists finished revising models — while Brent still traded above $110. Bloomberg Economics warned the coming week’s inflation data would be the first snapshot to show that pass-through in the official numbers, not just on station signs. The screen trade is crude. The mortgage-rate trade is CPI.
Why the Pump Print Hits Before Brent Finishes Moving
Crude futures react to tanker queues and headlines in hours. The consumer price index samples prices over weeks and publishes with a lag. Energy is a thin slice of the basket by weight, but gasoline is visible: when the weekly US regular gasoline series from FRED jumps, headline CPI almost always follows unless core goods collapse at the same time. The EIA’s weekly petroleum status report shows the same story in inventories and implied demand — product cracks matter for how long pump pain lasts.
Traders staring only at Brent are tracking supply risk. Traders who care about the Fed’s reaction function need the retail channel.
The Bureau of Labor Statistics samples thousands of prices each month. Gasoline enters the CPI basket with a weight that moves slowly, but the level can swing hard when rack prices reset after a geopolitical shock. You do not need a PhD in seasonal adjustment to understand the intuition: when the weekly retail series breaks higher in March and April, the month-over-month CPI line usually steepens unless other components offset it.
We already mapped how the Gulf disruption repriced global crude and spreads — see our Brent–WTI and Hormuz breakdown from March. For how the dollar and safe-haven flows interacted with that shock, we covered the dollar’s bitter-triumph regime in the same window. This piece is the other half of the trade: when those oil moves show up in US household inflation.
Headline vs Core: Which Number Moves the Fed?
Headline CPI can spike when energy pops even if services inflation grinds lower. Core strips food and energy. Chair Powell’s public framing has treated energy as volatile — but a sustained supply shock is not the same as a one-off refinery outage. If headline prints hot for two consecutive releases while payrolls stay positive, the committee’s language on “data dependence” starts to sound less symmetric.
Real yields tell part of the story. When nominal rates barely fall as headline inflation rises, financial conditions tighten through the price level, not through easier policy. That is the channel where equity duration and long-cycle tech get squeezed even without a hawkish dot plot. Index-level hedges only work if you size them against the inflation surprise, not the Twitter feed. Volatility spikes fade; CPI tables linger.
Bond markets were already leaning toward policy inertia: Treasury traders have priced the Fed holding rates steady through year-end while war uncertainty dominates the data calendar. Inflation prints that embed gasoline lift the burden of proof onto anyone arguing for cuts before 2027.
Labor cooling does not automatically cancel an energy tax. Wage growth has slowed from post-pandemic peaks, which buys the Fed some cover on services. It does not refill gas tanks. Households still face the cash-flow hit at the pump this quarter.
The Fed’s official target is PCE inflation, not CPI. The two diverge around medical pricing and owner-equivalent rent timing. Directionally, though, a gasoline-led CPI surprise rarely stays trapped in one index: energy shows up in transportation services, airfares, and shipping inputs that eventually touch core goods. That is why headline prints still matter even when core is the policy focus.
What to Watch Instead of Another Oil Price Chart
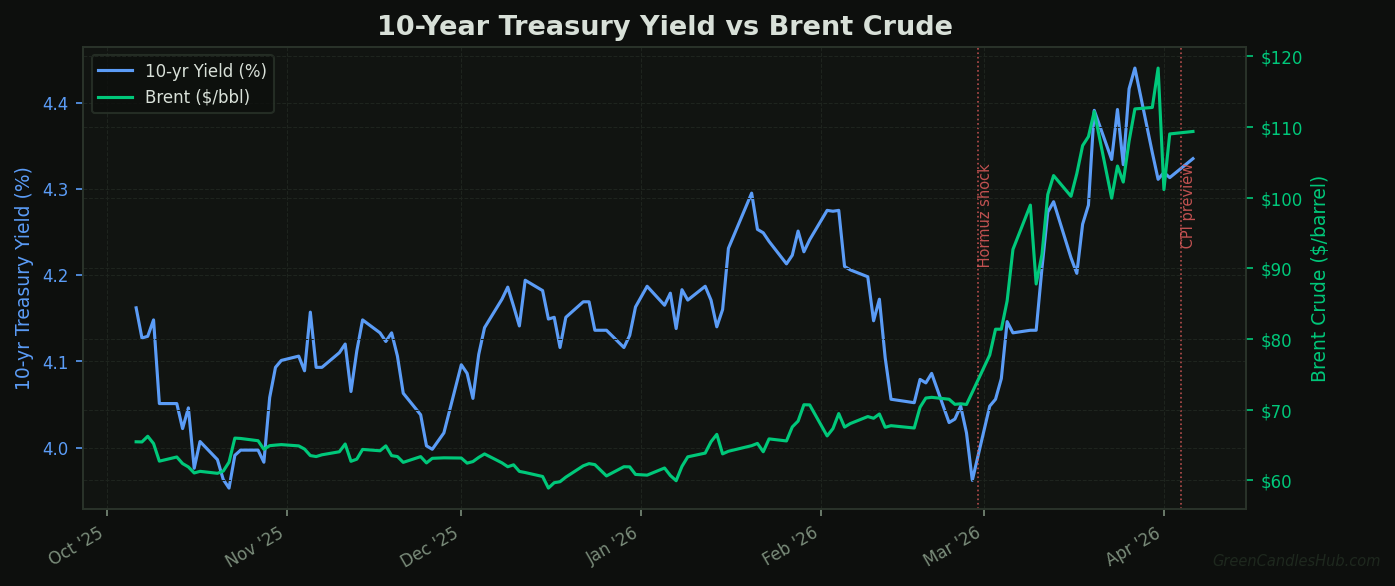
Use cross-assets as a sanity check. When Brent rises alongside nominal Treasury yields, the market is often pricing either term premium or a stagflation-style mix — energy tax on growth without offsetting dovish policy. The chart below pairs the 10-year yield with Brent over six months so you can see whether bonds and crude are moving on the same fear. Divergence matters too: yields down while oil rips can mean growth fear dominates inflation fear.
For the release itself, watch the Cleveland Fed’s inflation nowcast the day before the print. It has led official CPI in tight windows when gasoline moves abruptly. A gap between nowcast and consensus matters more than oil’s daily candle. Consensus is a lagging summary of stale forecasts; the nowcast updates as high-frequency prices roll in.
Also scan the Bureau of Labor Statistics release tables for gasoline’s contribution to the month-over-month change. A single line item rarely moves the whole index by itself, but gasoline can contribute a disproportionate share of headline volatility when the move is large enough.
Positioning: Curves, Not Headlines
Ceasefire tweets can gap crude overnight. CPI revisions do not. Position sizing for this setup belongs in front-end yields and inflation breakevens, not in chasing the nearest energy equity bounce. Integrated oil names can rally on refining cracks; the macro trade is whether inflation data forces a longer stay at elevated real rates.
If headline beats consensus by more than a couple of tenths and gasoline explains most of the upside, treat Fed-funds futures priced for a full year on hold as vulnerable into the next FOMC. The 2-year note is the cleaner read than oil’s intraday range.
Watch month-over-month headline versus the Cleveland nowcast the day before. If gasoline contributes more than half of headline upside in the Bureau of Labor Statistics tables, repeat the exercise on the following print — one hot month is noise; two is a pattern the committee cannot hand-wave without a credible forecast revision.
Disclaimer: This article is for informational purposes only and does not constitute financial advice. Nothing here should be taken as a recommendation to buy or sell any security or asset. Always do your own research and consult a qualified financial adviser before making investment decisions.