
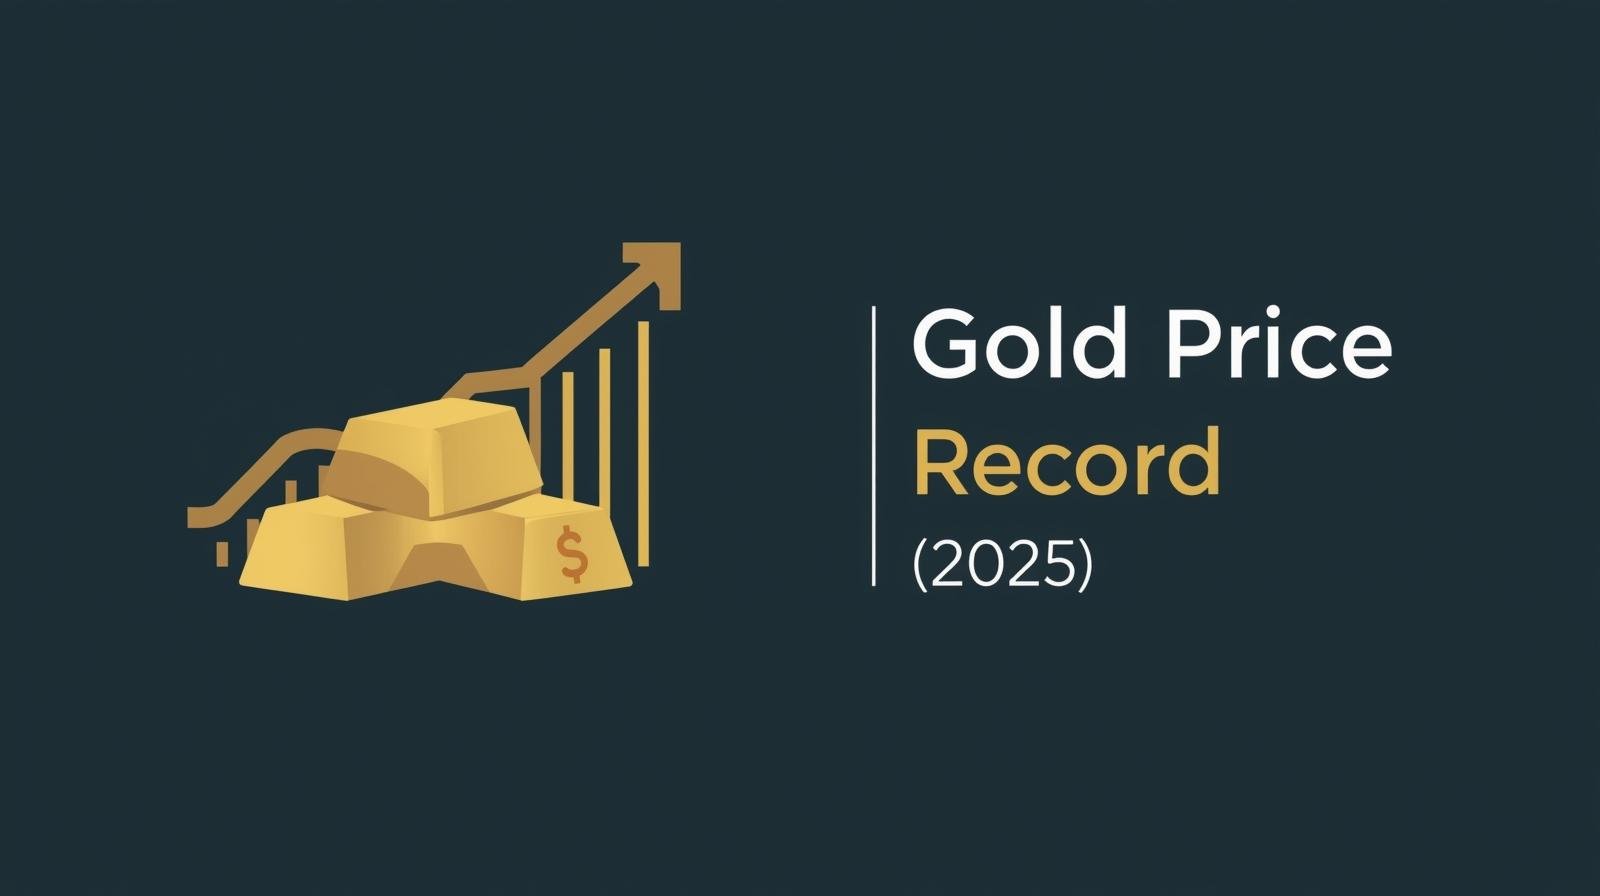
Gold Hits New Highs in 2025: The Real Forces Behind the Rally
Gold price record 2025 has become the headline macro story of the year. With bullion pushing through fresh highs, investors are asking the same questions: what’s driving the move, how durable is it, and how should a diversified portfolio respond? This primer breaks down the structural and cyclical forces behind gold’s surge, outlines scenarios for 2026, and distills practical portfolio takeaways.
Why gold matters in a modern portfolio
Gold is not a cash-flowing asset, yet it plays a distinct role across cycles:
- Store of value when real yields fall: when inflation-adjusted interest rates compress, the “opportunity cost” of holding gold declines.
- Safe-haven insurance: during geopolitical shocks, fiscal stress, or monetary regime uncertainty, gold often attracts defensive flows.
- Diversifier: correlations with equities can flip negative in stress, improving drawdown characteristics at the portfolio level.
- Reserve asset: central banks hold and actively manage gold as part of their FX reserve mix, adding a structural buyer at times.
2025 in focus: a record-setting run
By early October, spot gold surged past the $3,900/oz milestone, registering successive highs as markets priced a looser policy path and leaned into safe-haven assets amid policy and political noise. Momentum accelerated through late September into October, with a sequence of record intraday prints and firm closes.
Key catalysts behind the breakout
- Policy expectations: Markets increasingly discount additional U.S. rate cuts following a first step in September, compressing real yields and supporting non-yielding assets.
- Macro headline risk: Shutdown dynamics and broader political uncertainty increased hedging demand.
- Dollar dynamics: A softer U.S. dollar amplifies international purchasing power for dollar-priced bullion and tends to coincide with stronger precious-metal performance.
- Official-sector demand: Central banks remain net buyers, even at elevated prices—an important reminder that strategic allocation, not just tactical trading, is in play.
Decomposing gold’s drivers: a professional toolkit
For a disciplined view, map the gold complex to four interacting pillars: real yields, the U.S. dollar, official/institutional flows, and micro/technical structure.
1) Real yields and the policy path
Historically, the tightest linkage for gold sits with 10-year real yields. All else equal, falling real yields lift the relative appeal of zero-carry assets. As the market shifts toward further easing, duration-sensitive assets and gold both benefit. The key risk is a data-driven repricing of the path: any upside surprise in growth or inflation that pushes real yields higher can spark a corrective phase.
2) Dollar trend and global liquidity
Gold’s inverse relationship with the DXY persists for intuitive reasons—non-U.S. buyers face a lower local-currency cost when the dollar weakens. Beyond valuation mechanics, a softer dollar often coincides with improved global liquidity conditions, supporting broad commodity baskets and reinforcing the bid for stores of value.
3) Central bank and ETF flows
Official-sector flows have been a major underappreciated tailwind in this cycle. Multiple reserve managers have increased allocations for diversification, sanction-resilience, and credibility reasons. While exchange-traded products (ETPs/ETFs) can swing tactically, the combination of sticky central-bank bids and intermittent ETF inflows has created a sturdier demand base than in prior cycles.
4) Supply, cost curve, and recycling
Mine supply responds slowly. New projects face permitting, ESG, and cost-inflation hurdles, while mature assets contend with grade decline. Recycling provides a price-sensitive buffer but rarely offsets strong cyclical demand. The near-term supply elasticity is modest, which allows demand shocks to transmit into price quickly.
Technical structure: what the chart is signaling
- Breakout above prior resistance: Sustained closes above the former ceiling turned that zone into support, inviting trend-following and CTA flows.
- Momentum regime: Multi-week RSI strength and positive breadth (gold, silver, and select miners) confirm a momentum phase—with the caveat that momentum regimes can overshoot and mean-revert abruptly.
- Pullback zones: Former resistance bands and rising 50-/100-day moving averages are the first areas to watch for “buy-the-dip” interest.
Fundamental scenarios into 2026
Rather than point forecasts, anchor on scenario bands and the drivers that would push the tape:
Base case: constructive range with higher floor
Policy eases on trend, real yields drift lower, and the dollar trades sideways-to-soft. Central banks keep buying, ETFs are modest net positive. Under this mix, gold maintains a higher floor versus prior cycles, with episodic tests of new highs.
Upside risk: policy surprise + risk shock
A sharper dollar decline, quicker-than-expected easing, or a geopolitical/financial shock could squeeze shorts and pull in incremental institutional demand. In this state, parabolic extensions are possible, especially if silver and miners confirm.
Downside risk: resilient growth, stickier inflation
If growth runs hot and the inflation mix forces a higher-for-longer stance on real rates, gold could retrace toward prior breakout zones. Rotations into cyclicals and credit could siphon flows until the next macro wobble.
Positioning and portfolio construction
For allocators, the question is less “should I own gold?” and more “how, how much, and when?”
- Core allocation (strategic): A small but persistent sleeve (e.g., low- to mid-single digits of portfolio NAV) has historically improved risk-adjusted returns across regimes.
- Tactical overlay: Use weakness into support or volatility events to add, trimming into extensions. Pair with options to define risk in momentum phases.
- Vehicle selection: Physical-backed ETFs offer convenience; futures provide precision and margin efficiency; miners offer leverage to price but layer in idiosyncratic (operational, jurisdictional) risks.
- Funding choice: Consider funding from cash or long-duration nominal bonds in regimes where real yields are your primary risk to gold.
- Risk management: Pre-commit to rebalance bands or a profit-taking grid to avoid behavioral mistakes during vertical moves.
What could change the thesis quickly?
- Upside accelerants: faster policy easing; decisive USD break lower; renewed official-sector accumulation; synchronized bid across precious metals.
- Downside hazards: hawkish repricing of the policy path; upside inflation surprises that lift real yields; sharp risk-on in equities drawing capital away.
- Micro catalysts: ETF outflows after a blow-off top; speculative positioning extremes that unwind; miner hedging that blunts spot-beta transmission.
Actionable checklist for readers
- Define your role for gold: hedge, return enhancer, or both. Size accordingly.
- Track the four pillars: real yields, DXY, official/ETF flows, and price-structure signals.
- Use rules: entries on pullbacks to rising MAs; trims on extensions vs. weekly ATR; rebalance bands to keep risk in bounds.
- Diversify within precious metals prudently: silver and platinum add beta but increase volatility—treat as tactical satellites.
Frequently asked questions
Is gold still an inflation hedge?
Gold’s inflation-hedge properties are state dependent. It hedges best when inflation erodes real yields and credibility, or when policy responses look asymmetric. In disinflation with rising real rates, it can lag.
Should I buy miners instead of gold?
Miners are operationally leveraged to bullion and can outperform in sustained uptrends. They also carry execution, cost, and jurisdiction risks. For pure macro exposure, bullion or bullion-backed vehicles are cleaner; for higher beta, consider a measured miners sleeve.
What time horizon makes sense?
Tactical traders can anchor to weeks and months, but allocators should think in multi-year terms and rebalance systematically. The path can be volatile even if the long-term role remains valid.
Bottom line
The gold price record 2025 rally is grounded in fundamentals—easing real yields, a softer dollar, and persistent official-sector demand—then amplified by positioning and momentum. Into 2026, the distribution skews constructive but not one-way. Treat gold as a risk-management tool with return optionality, size it deliberately, and let rules govern entries and exits.
Further reading and data sources
- World Gold Council – 2025 Demand Trends
- Reuters – Gold smashes through $3,900/oz
- Financial Times – Gold-plated FOMO rally
This article is for informational and educational purposes only. It does not constitute financial, investment, or legal advice.
All economic and financial policy discussions are presented for scenario analysis and illustration only. Investing involves high risk, and you may lose capital.
Always conduct your own independent research and consult a qualified professional before making any financial decisions.